Histogram
BIFIE.hist.RdComputes a histogram with same output as in
graphics::hist.
Statistical inference is not conducted for this method.
Arguments
- BIFIEobj
Object of class
BIFIEdata- vars
Vector of variables for which statistics should be computed.
- breaks
Optional vector of breaks. Otherwise, it will be automatically defined.
- group
Optional grouping variable(s)
- group_values
Optional vector of grouping values. This can be omitted and grouping values will be determined automatically.
- object
Object of class
BIFIE.hist- x
Object of class
BIFIE.hist- ask
Optional logical whether it should be asked for new plots.
- ...
Further arguments to be passed
Value
A list with following entries
- histobj
List with objects of class
histogram- output
More extensive output
- ...
More values
Examples
#############################################################################
# EXAMPLE 1: Imputed TIMSS dataset
#############################################################################
data(data.timss1)
data(data.timssrep)
# create BIFIE.dat object
bifieobj <- BIFIEsurvey::BIFIE.data( data.list=data.timss1, wgt=data.timss1[[1]]$TOTWGT,
wgtrep=data.timssrep[, -1 ] )
#> +++ Generate BIFIE.data object
#> |*****|
#> |-----|
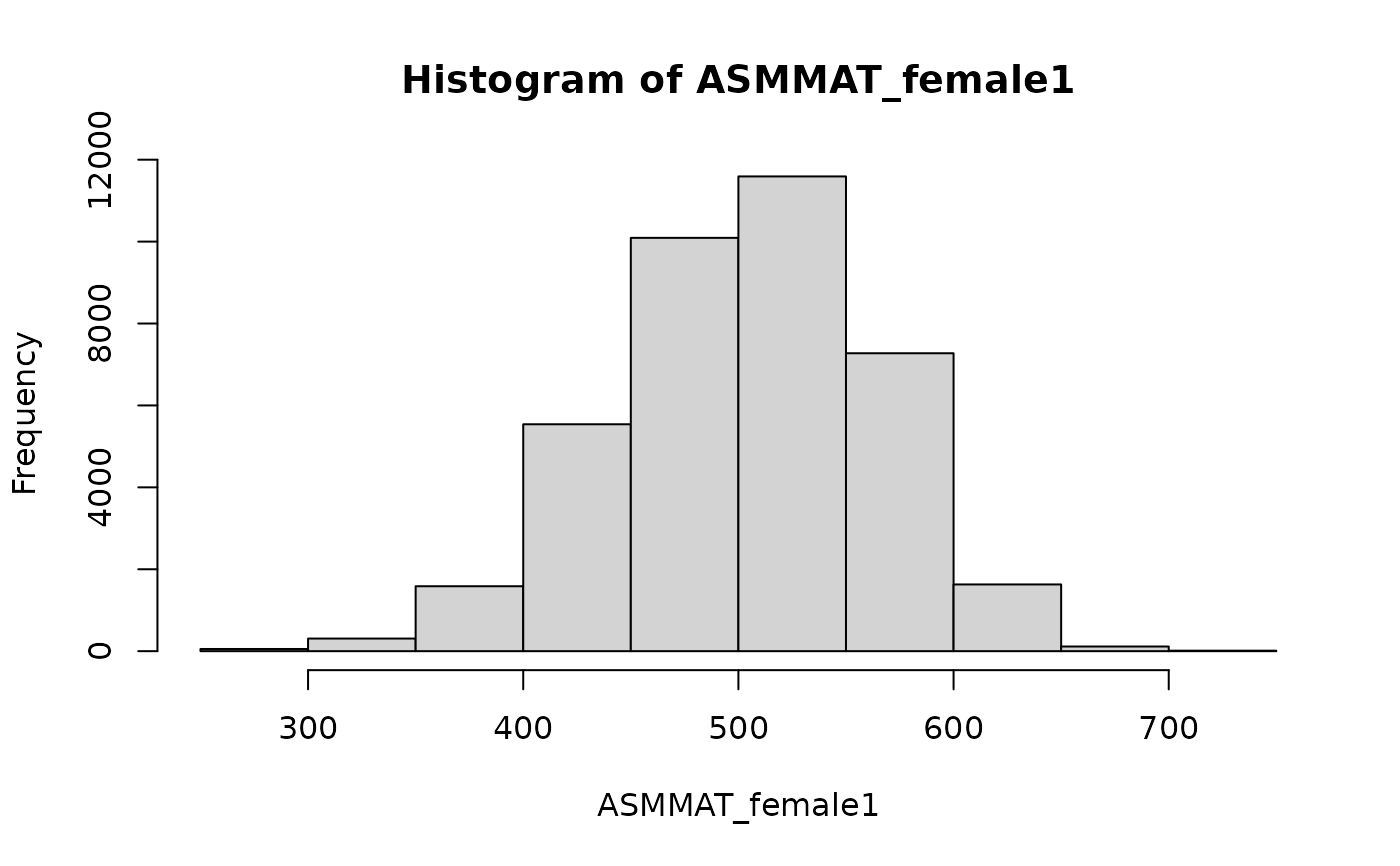
# histogram
res1 <- BIFIEsurvey::BIFIE.hist( bifieobj, vars="ASMMAT", group="female" )
#> |*****|
#> |-----|
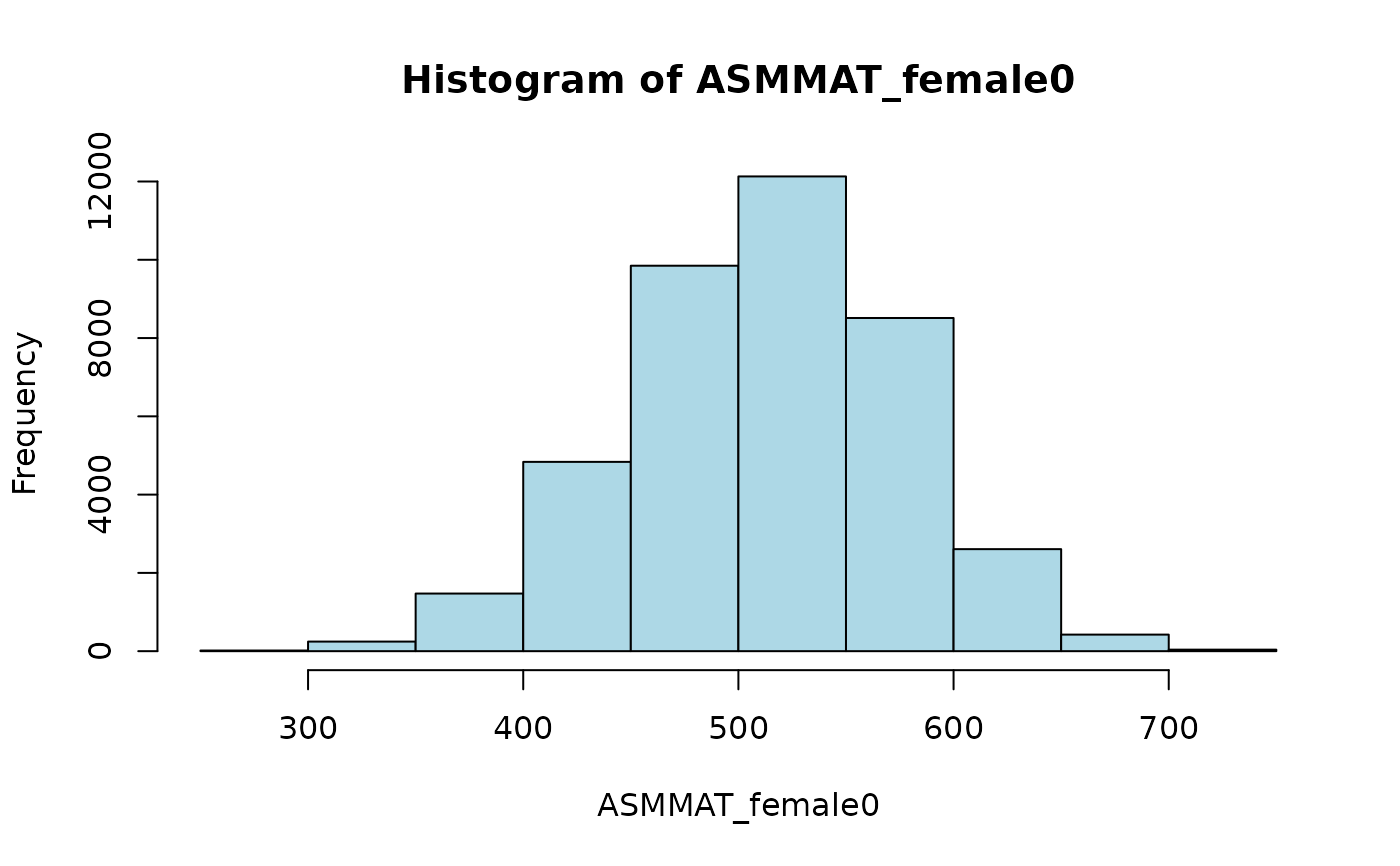
# plot histogram for first group (female=0)
plot( res1$histobj$ASMMAT_female0, col="lightblue")
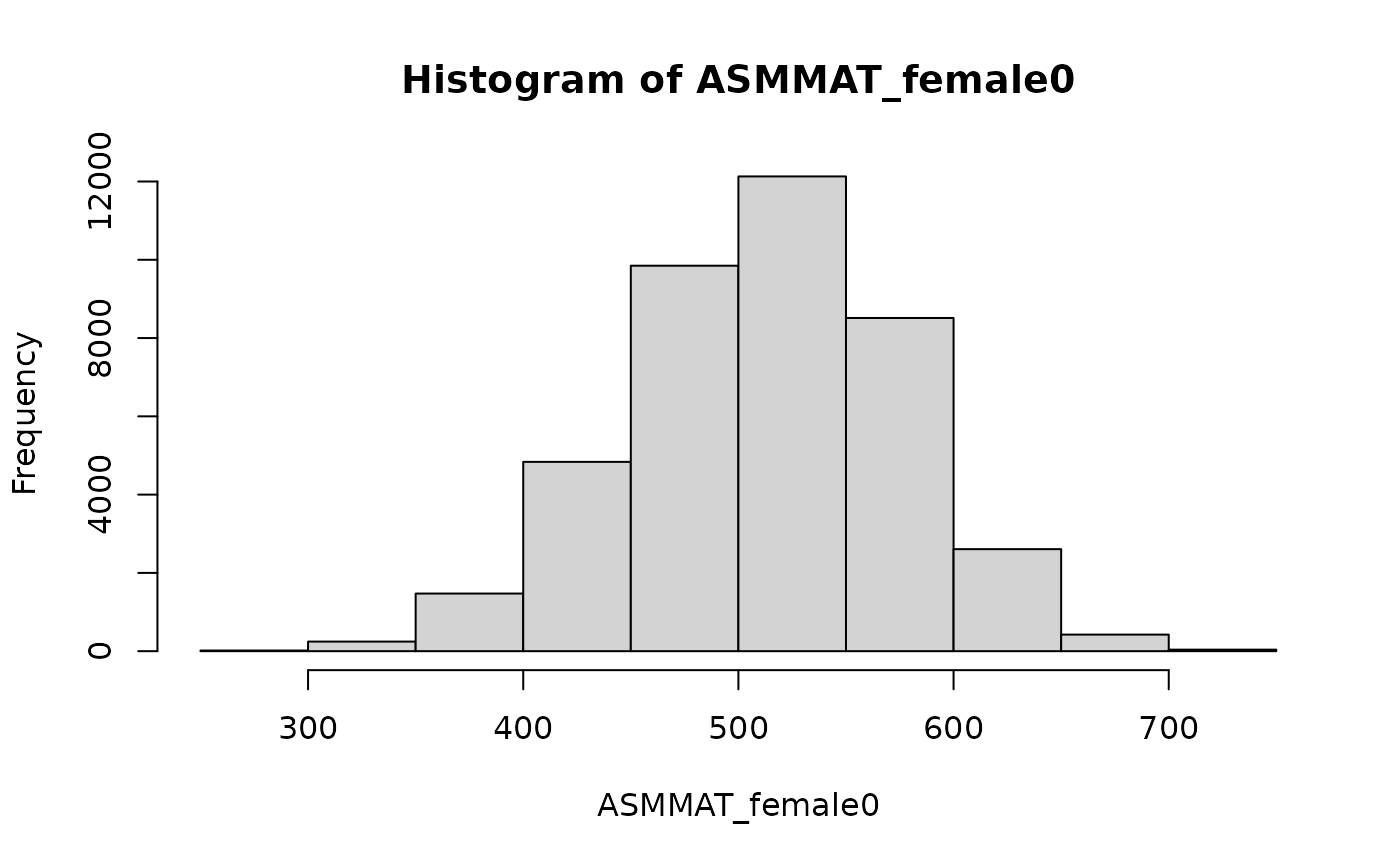
 # plot both histograms after each other
plot( res1 )
# plot both histograms after each other
plot( res1 )
 # user-defined vector of breaks
res2 <- BIFIEsurvey::BIFIE.hist( bifieobj, vars="ASMMAT",
breaks=seq(0,900,10), group="female" )
#> |*****|
#> |-----|
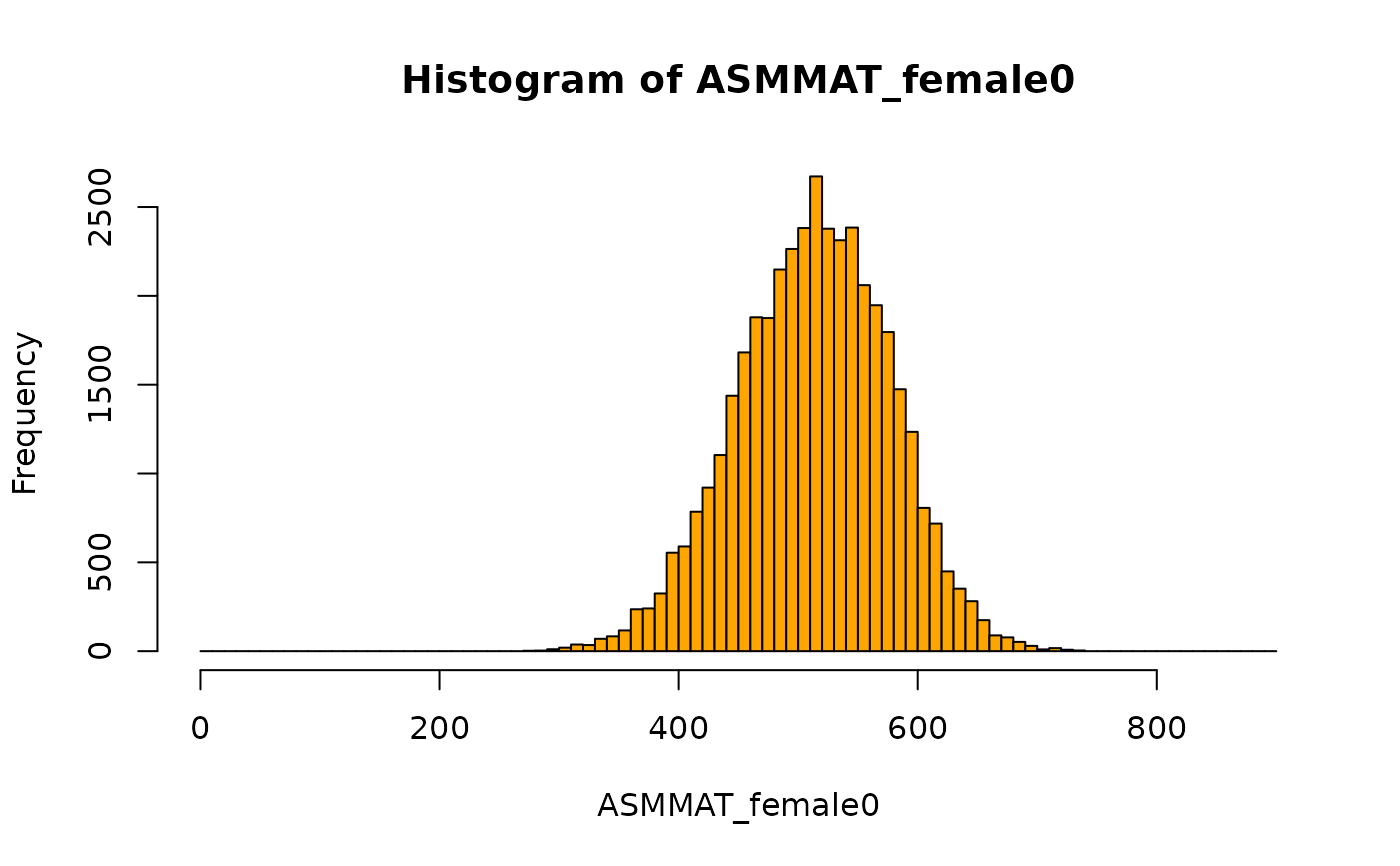
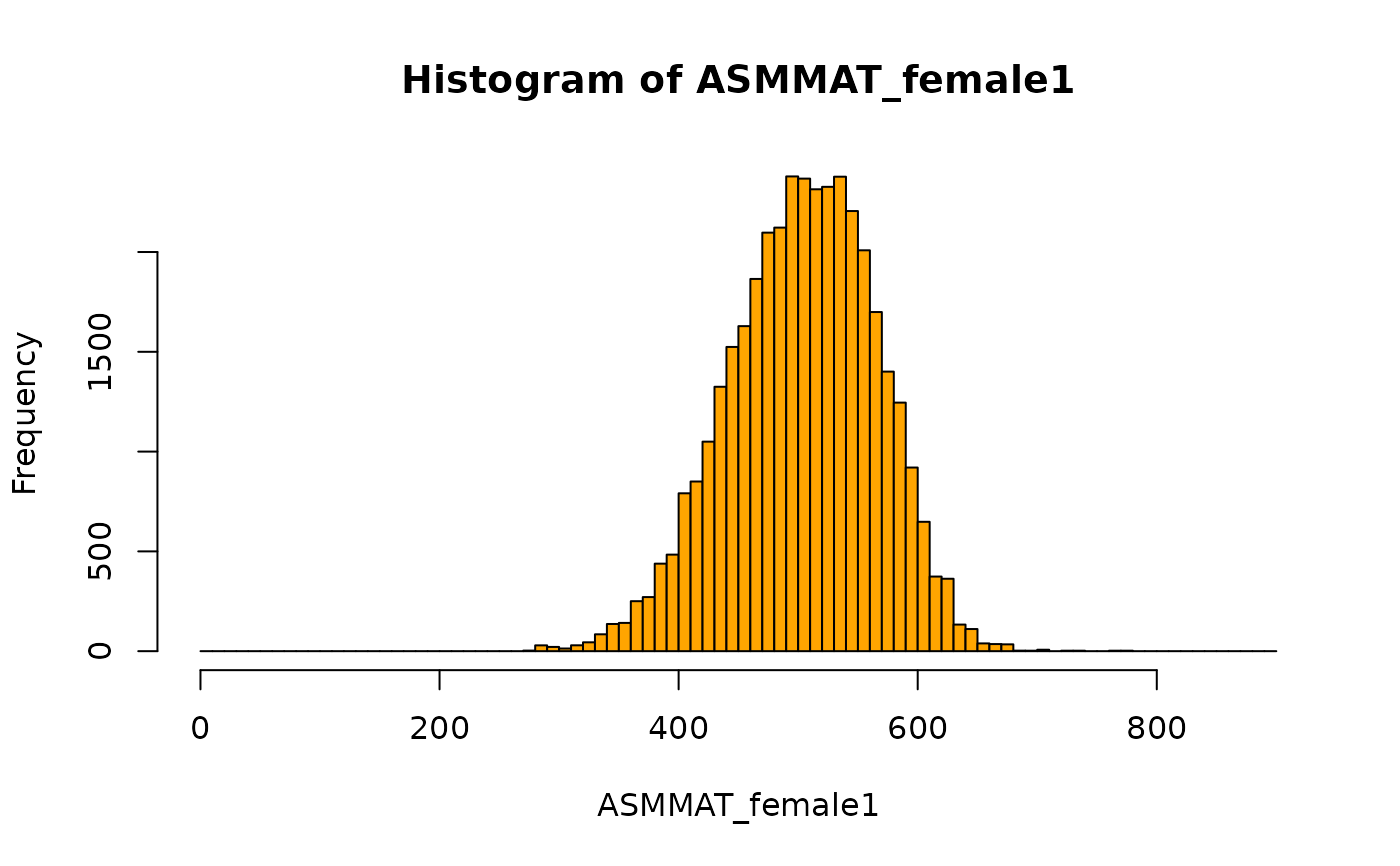
plot( res2, col="orange")
# user-defined vector of breaks
res2 <- BIFIEsurvey::BIFIE.hist( bifieobj, vars="ASMMAT",
breaks=seq(0,900,10), group="female" )
#> |*****|
#> |-----|
plot( res2, col="orange")